Performance Benchmarking as Part of your CI/CD Pipeline

Originally published here on July 12, 2022.

Continuous Integration and Continuous Delivery (CI/CD) is perhaps best represented by the infinity symbol. It is something that is constantly ongoing, new integrations are rolled out while not interrupting the flow of information that is already running, as to stop systems in order to update them can be costly and inefficient.

In order to ensure that you can successfully implement the latest builds into your system, it is important to know how well they will run alongside the components that are already installed and where there may be bottlenecks.

The method of figuring this out is called performance benchmarking and is generally the final step in testing before actually deploying a new integration to the live software environment.

Benefits of Performance Benchmarking

Find and Improve Slow Code

Before any new software update goes live, the development team should be looking at the performance benchmarking software in order to identify the areas where there is slow or inefficient code and strategizing about how this can be improved upon.

Automated Regression testing

This method of testing runs automatically and centres on testing processes that guarantee software is recompiled correctly after an update. In addition, there is also testing for the workflow or the core logic of the software, with the aim of identifying whether the software is still functionally correct. It is also important to test all other supporting services that rely on and interact with the core software.

Benchmark All Aspects of your System

Good benchmarking software will allow for benchmarking of all aspects of your system from APIs, libraries, software builds and release candidates. This means that you can easily understand from a DevOps perspective, which aspects of your system are likely to be the most resource-intensive and where further changes and optimizations can be made.

Increase the Quality of your Applications

The business case for performance benchmarking as part of your CI/CD pipeline is bolstered by the fact that identifying where there needs to be improvement will allow for your applications to improve over time, leading to better user experiences for everyone and fewer complaints that need to be dealt with.

Why Choose Nastel Technologies?

Nastel has developed CyBench, which is the world’s number one performance benchmarking tool. Cybench features a wide range of integration possibilities and works with Maven, Gradle, Jenkins, Eclipse, IntelliJ, GitHub and more.

With CyBench, it is possible to benchmark your entire Java stack on any platform in a matter of minutes and compare results across containers, virtual machines and the cloud in seconds. This allows a realistic idea of performance across your entire network.

CyBench allows this elite level of benchmarking without having to code anything and displays the results on an attractive and intuitive graphical user interface. What this means for your business is that you will be able to deliver 10x software faster and more efficiently than ever before. Integrating Cybench as part of your CI/CD pipeline will allow you to streamline your integration process and implement rigorous regression testing.

Managing Kafka on AWS with Nastel Navigator

Originally published here on March 30, 2022.

Apache Kafka is a very popular open-source distributed event streaming platform used by thousands of companies for high-performance data pipelines, streaming analytics, data integration, and mission-critical applications. Amazon MSK is a fully managed Kafka service that makes using Kafka even easier. But how do you get started with Kafka on AWS? How do you migrate your existing Kafka environment to the cloud? How do you manage many Kafka environments at once?  How do you give the application teams easy audited access to their data without putting other teams at risk?

Nastel Navigator provides a single GUI for migration and management of multiple middleware products including Apache Kafka and Amazon MSK. It enables you to reduce operational risk with automated audited deployment, migration, secure DevOps self-service with full lifecycle management, integrated into DevOps tooling for debugging, root cause analysis, diagnostics, and remediation. You can securely manage multiple middleware products including Kafka, IBM MQ, and TIBCO EMS on multiple servers on multiple clouds and on-premises.

Here you can see a typical screenshot of the GUI. It is entirely customizable. In this case, the user has Kafka, TIBCO, and MQ on different tabs. On the Kafka tab, they have viewlets that allow them to view only the topics, partitions, and consumers that are relevant to their applications.

In this blog post, we explain how to connect Nastel Navigator, available in AWS Marketplace, with a Kafka server. Nastel Navigator uses a central server environment that connects to and collects data remotely from the Kafka clusters and provides access to the entire configuration.

Prerequisites

To run this solution, you must have the following prerequisites:

  • An AWS account – if you don’t already have one, create one.
  • An installation of Apache Kafka. This could be one that you’ve installed yourself from the Kafka community or it could be the AWS MSK managed service.
  • Nastel Navigator can be installed from AWS Marketplace. There is a choice of editions depending on the number of Kafka brokers. Nastel Navigator Express is the completely free version that can be used for this walkthrough.

Solution overview

The Navigator platform consists of a Complex Event Processor (CEP) Server, a Workgroup server, a Domain Server, and a Web Server. The platform interacts with multiple middleware instances over TCPIP and is accessed by multiple users via the Web Server.

Navigator Architecture with Kafka agents

Solution walkthrough

For information about the installation and setup of this central server, see the Nastel documentation. This post starts at the point where the server has been installed and is ready to operate.

Because Navigator connects as a client connection, we use standard connection details and options. Although this post uses Amazon MSK, you have other options for Kafka. In this case, we get these details from the Amazon MSK cluster configuration.

  1. Log in to the Amazon MSK Cluster and select ‘View Client Information’
  2. Copy the bootstrap server for the TLS or Plaintext bootstrap server to the clipboard.
  3. Log in to the Nastel Navigator interface and create a definition for this Kafka cluster. To do this, go to the Workspace tab, select the WGS line, click on Create, then Remote Kafka Managers.
  4. Provide the details from the information that we collected, namely the name of the cluster and the bootstrap server.
  5. If necessary, add other properties on the Config tab. This could include credentials and connection attributes.

Now you’re ready to manage this Kafka cluster. As well as viewing authorized topics and partitions, you can drill down to see individual messages in them, add new test messages, and perform other actions such as creating, deleting, and changing Kafka definitions.

Conclusion

For more information about usage, see the Nastel Resource Center. For more information on the Nastel platform and other capabilities, contact us at the Nastel website.

Microservices Without Observability Is Madness

Featured

Originally published here on August 26, 2021.

As I said before, Speed is King. Business requirements for applications and architecture change all the time, driven by changes in customer needs, competition, and innovation and this only seems to be accelerating. Application developers must not be the blocker to business. We need business changes at the speed of life, not at the speed of software development.

Thirteen years ago much of my time was spent helping customers rearchitect their monolithic applications into service-oriented architectures (SOA). We broke the applications into self-contained, reusable, stateless business functions which could be managed, modified, tested, reused, or replaced individually without impacting the rest of the application. This enabled business agility, reducing cost and improving time to market.

Over the last ten years or so, companies have been exploring the benefits of the cloud. Initially, this was also quite monolithic i.e. lifting and shifting large applications onto outsourced virtual servers or outsourcing email or CRM to web-hosted providers. However, more recently we’ve started to see newer applications being developed with finer-grained components stored in the most appropriate place. Confidential data may be stored on-premise, open APIs can enable public lookup services, the CRM can be integrated with the marketing functions and the internal cloud-hosted product warehouse. A single business application is typically spread across a hybrid cloud of different cloud providers, and on-premise services.

They are at risk of sprawling so much that no one knows how they work or how to maintain them and they will be a blocker to innovation again. The drivers behind SOA are here again. Applications need to be designed as combinations of smaller self-contained, loosely coupled, stateless business functions or microservices.

Management of these microservices is even more powerful than it was with SOA. They can be quickly pushed out by DevOps, moved between clouds, they can be ephemeral and serverless and containerized.

So, a single business transaction can flow across many different services, hosted on different servers in different countries, sometimes managed by different companies. The microservices are being constantly updated, augmented, migrated in real-time. The topology of the application can change significantly on a daily basis.

It’s amazing that we’ve had so many software development innovations to enable this rapid innovation for our lives. But what happens if something goes wrong? What happens when a transaction doesn’t reach its target? Who knows what the topology is supposed to look like? How can it be visualized when it’s constantly morphing? Who knows where to go to find the transaction? How can you search for it and fix it when it could be anywhere on any technology?

Nastel XRay addresses this. XRay dynamically builds a topology view based on the real data that flows through the distributed application. It gives end-to-end observability of the true behaviour of your application in a constantly changing agile world. It highlights problem transactions based on anomalies and enables you to drill down to those transactions, carry out root cause analytics and perform remediation. It would be madness to have access to all the benefits that microservices can give you and not use them to the fullest extent just because your monitoring and management software and processes can’t keep up.

Is Observability the New Monitoring?

Originally published here on Oct 7th 2020

Since rejoining Nastel, after a long period away in the cloud, I’ve been wondering why people are now talking about ‘observability’ when they used to talk about ‘monitoring’. Why is there a new term? A new piece of technical jargon. I’ve been reading up on it and it seems that each vendor describes it slightly differently, and amazingly that difference is the key feature that makes their product different to everyone else’s. Some are talking about Java byte code instrumentation, some are talking about the complete absence of instrumentation – inferring things from the outside, some talk about Artificial Intelligence, some about DevOps. Some think observability is seeing the end to end application whereas monitoring is seeing the low level IT.

Why is it not just ‘monitorability’? Why not “application monitorability” or “CPU observability”? To find the “true” answer, I went back to the Latin etymology:

“Monitor” comes from the Latin “monere” meaning “to notify or alert”.

“Observability” comes from the Latin “observabilis” meaning “watch over, attend to, guard” from ob “in front of, before” + servare “to watch, keep safe.”

This highlights a significant distinction. Monitoring is about telling you when something has gone wrong. Observability is about making sure that something is working. It is fundamental in the paradigm shift from operations monitoring to Site Reliability Engineering (SRE).

Consider what happens when your house catches fire. At some point the fire gets so bad that your neighbours can see the flames, so they call the emergency services. A switchboard operator directs them to the fire station, and they send out a fire engine who come as quickly as they can and put out the fire. So, monitoring and alerting has handled and stopped the problem, but you’ve still lost half your house, all your photo albums, maybe someone was hurt, and it cost a lot of money.

Alternatively, with SRE, you constantly “watch over” the house to be “in front of” a problem “before” it happens. You do regular maintenance, have smoke detectors, heat detectors, and sprinklers. You watch the whole house and ensure that it is fine all the time so that it never gets to the point of catching fire.

The term “observability” comes from control theory where observability is a measure of how well internal states of a system can be inferred from knowledge of its external outputs. And yet some people say that observability is a culture of instrumenting systems and applications to collect metrics and logs. Well, yes, certainly the more key indicators that you can provide to monitor for, then the more likely you can observe the state of the holistic system. But strictly with observability you don’t need instrumentation. You should view the external state of the system and infer potential issues from there. There are key indicators to keep an eye on:

Latency – time to service a request

Traffic – demand placed on system

Error rate – rate of failed requests

Saturation – which resources are most constrained

Watching the current state of these indicators, and how they change over time will enable you to maintain the availability and reliability of the system, rather than relying on alerts when a failure has happened.

Interestingly, over the last 25 years, Nastel’s product set has evolved as this approach to application and middleware availability has changed. We began with MQControl (now Navigator) which responded to events. It could raise an alert if a queue was full or a channel was down. Then we released AutoPilot which continuously watched individual metrics such as current depth. It did statistical analysis of trends to see whether a problem was coming. More recently Nastel developed XRay. Nastel XRay dynamically builds a holistic view of the entire system, capturing data as components of a transaction pass through different servers and middleware(s), stores this in a time series database cluster and runs analytics in real-time to identify trends, fixing issues before they occur. It gives “observability”.

So, does observability replace monitoring? Does XRay replace AutoPilot and Navigator? The answer is no. They’re complementary. All are needed – events, polling, and end-to-end tracking are all needed to be able to identify trends and potential issues in the overall business application, then drill down to the technical root cause and fix it. This is why Nastel has now released Navigator X, a combined solution including the features of Navigator, AutoPilot, and XRay. See here for more information.

Speed Is King In Covid Times

This was first published here on Dec 15th 2020

Business agility is critical. It’s shocking and saddening to see the number of large household names that we grew up with going to administration. Companies that have always been there and we thought always would. Companies like J.C. Penney, Sears, Arcadia group have not managed to adapt to the new world. The world of Covid-19 but also the changes that were happening to consumer habits before that. Similarly we were shocked in 2012 when Kodak filed for Chapter 11 and when, in 1993 IBM posted the biggest corporate loss in American history. And yet some companies have managed to pivot, to turn on a dime – Boohoo, Unilever, and Spotify have turned the Titanic and become success stories. As Lou Gerstner said of IBM, “Who says elephants can’t dance.”

When my colleagues and I at IBM first developed IBM MQ in the early 90s, we used the waterfall methodology. We collected requirements, wrote the high level design, then the low level design, wrote code, unit testing, fixing, functional testing, fixing, system testing, fixing, and eventually, after two years, we released it. Fortunately it was a big success. Partially because we OEMed a product from the people at Nastel to get us to market quickly while we did this. The product we developed before that also took two years and sold 14 copies because the market and customer requirements moved on during that time.

Now we realise that speed is king. Being able to turn on a dime is everything, so most companies have moved their IT to the agile methodology. We use DevOps with automation, continuous integration, continuous deployment, and constant checking that the solution matches the requirements and that the requirements are still valid. Taking the example of IBM MQ V1 to extremes, we release products in much more frequent, but smaller increments. With agile, companies reduced the time from two years to six months. With DevOps it went down to a month, and now adding in cloud, companies like Netflix and Eli Lilly can get from requirements, to code, to test, to production in an hour.

We can remove the hardware acquisition and deployment time with cloud. We remove the development/test/deployment handover time using DevOps.

Now that the process is speeded up, it can be much more iterative. Rather than lots of separate releases, it becomes a constant cycle of monitoring the deployed software in test and production for errors and improvement opportunities and feeding them back into the development process for fixes and new releases.

Nastel has a complete integrated solution, Navigator X, to handle these agile needs, enabling fast, secure, robust delivery and support of middleware-centric applications.

Navigator, AutoPilot, and XRay were always components of one solution, running on one shared architecture, but separated out for the different user roles. With DevOps the roles of development and operations merge and so we’ve recognised the need for a combined offering, Navigator X, which gives users access to all the functionality. For convenience we still refer to them by their different names but the real strength comes from combining them.

In the middleware development lifecycle, Navigator is used to create, migrate and administer the middleware configuration and messages. It has a strong security engine which restricts access to a fine granularity of objects according to roles and profiles, and it audits all actions. This is accessible via a GUI and also via automation from Jenkins, Ansible, Puppet etc. This security means that access to the environment doesn’t have to be restricted to middleware administrators anymore. Application developers can view the status of their own queues and messages, configure their environment, and fix any errors or issues. This secure self service adds governance and removes layers of approval steps and bottlenecks improving the much needed speed to market.

Four Navigator X components are useful in the testing phase. Navigator can put test messages, AutoPilot can validate that the configuration performs correctly without channels failing or queues filling, XRay can give an end to end transaction view, and Cybench automatically checks the performance of the Java based applications and compares them with previous tests and expected outcomes. Failures can be investigated and fixes fed back to the development phase. With the support of cloud and containers, a test environment can be automatically spun up, tested, and destroyed in a matter of minutes. Again, this automated testing is key to speed and gaining the business agility.

Despite the name, the automation that AutoPilot delivers is often overlooked. It can automatically deploy configurations and updates, remotely and securely as well as proactively fixing issues found by monitoring.

And finally (although there is no end in continuous integration/continuous deployment), we have monitoring. XRay gives full observability of the end to end business application in production. It can identify issues with individual transactions and then let you drill down to the root cause, find and fix the problem. Whilst many products are available for high level monitoring, speed is king. Ease of fixing issues without war rooms and handovers from support back to development is time critical. As business requirements change it is crucial to be able to change the dashboards and alerts in line with this. XRay is built with this as a core focus, with the time series database, the dashboard and alerts all integrated together. Very often the dashboards are dynamically created and changed automatically as the infrastructure and message flows change, requiring minimal time for set-up, with monitoring not being a blocker to business.

So now, more than ever before, speed and agility is critical. Our customers are moving their middleware centric applications to new methodologies, cloud, containers and automation and Nastel is here to help.

Managing and Enforcing Automated DevOps of MQ Environments

Nastel is well known for producing some powerful GUIs (graphical user interfaces) for managing and monitoring IBM MQ but is there still a place for these as the world moves towards DevOps with automated continuous integration and continuous delivery?

Of course, the answer is yes! All the technology that Nastel has spent 25 years developing as the back end behind the GUIs can provide a secure and robust interface between the new open source tooling and the MQ environments, and the GUIs themselves can still be used as much more intuitive components in the automated software development lifecycle, thus reducing the chances of human error and reducing the cost of ownership.

Untitled

The aim of an automated software development lifecycle is that the definitive source of the truth for the MQ configuration is held in a version control system, that all changes to it are recorded and audited and that the environment can be quickly and automatically be built from this as infrastructure as code. In this way a configuration can be built in one or more development environments, integrated into the version control system, with continuous integration, and then deployed into the test environments, then finally through pre-prod and into production. You can be confident that no manual changes to one environment have been missed in delivery to the next environment. As we move into a cloud-based utility computing world it becomes very useful and financially beneficial to only have environments for as long as they’re needed. We can spin up a test environment, deploy the configuration to it, run the tests and then shut the whole thing down and only pay for the infrastructure during the time when it’s needed.

So, what technologies are people using for this? Well, I’m finding that people are using versions of Git such as Github or Bitbucket for the version control system / source code control repository. For the continuous integration Jenkins is often used, and Ansible (free version or Ansible Tower) can be used to manage the deployment. Chef, Puppet and Terraform are other technologies that many choose as alternatives.

So, isn’t it enough to write lots of scripts using these open source technologies? Why would you need Nastel?

From the beginning (MQ V2) MQ has had a script command processor called MQSC which can define and alter all the objects within a queue manager. These scripts would form the basis of an automated deployment. However, we still need to design the environment which gets scripted, as well as defining the queue managers and associated objects (listener, command server, channel initiator etc).

Nastel Navigator provides a GUI in which a developer can design and unit test an MQ configuration. From here you can save the environment to a script which can be stored in a version control system and act as input to MQSC. With a Nastel agent on the target machine it can create the queue manager and associated objects as well as configuring it.

image002image004

So, you can put the configuration definitions into the source code repository from Navigator, or write them directly as text. Jenkins can detect the updates and pull them from the repository and then pass them to Ansible to initiate the deployment to the next environment.

image006

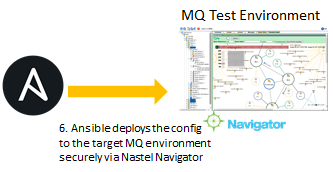
At this point Ansible can use the Nastel Navigator agent to create or update the new environment using the scripts. There is a lot of security functionality in Navigator which will ensure that developers can only update the objects which they are authorised to and so cannot affect the work or environments of other users or teams. This security and governance is critical to the DevOps dream becoming reality.

image007

So, we’ve migrated a configuration from development to test, and similarly it can move from test to production etc in a robust automated way. So, is that enough? What happens if someone makes changes in the test environment? What if they bypass the tooling and log straight in to fix something in production? How would we detect that? How can we get that change reflected back into the source control repository, to ensure that the Git version remains the golden copy, the single source of the truth, and that if production fails we can always reproduce it?

To address this Navigator can monitor the environment. Firstly, it can receive MQ Configuration events which are generated when certain MQ actions are taken such as alter, create and delete. Secondly, Navigator generates its own Alter events. It constantly compares the MQ environment to the version that it has stored in its database and when it spots a difference it records it as an event.

image008

You can then choose whether to roll back this change or to save it as a script for the version control system.

image010

Finally, how do we know that it’s a valid configuration? How do we know that the design, whether created as a script or through the GUI, conforms to the company’s design standards? Will it actually perform in the expected way? Do all the queue managers have dead letter queues? Have all the listeners and channel initiators been defined? Do all the transmission queues exist that are referred to by the channels and remote queue definitions? Do the objects conform to your naming standards?

This is where Nastel AutoPilot comes in. AutoPilot is a real time performance monitor and typically comes with Navigator. AutoPilot can monitor any of the environments, whether that’s the development environment or the test or production ones, and highlight any issues such as these.

image011

Conclusion

Whilst it is possible to build an automated software development lifecycle environment using open source tools, a lot of the effort can be reduced by adding Nastel’s Navigator and AutoPilot software to the mix, adding in its twenty five years of MQ and monitoring expertise to assure security, governance, and a lower cost of ownership.

I would be very keen to hear your comments, questions and experiences of DevOps with MQ. Please email me at sgarforth@nastel.com to discuss it further or leave comments below.

Using a Cloudant database with a BlueMix application

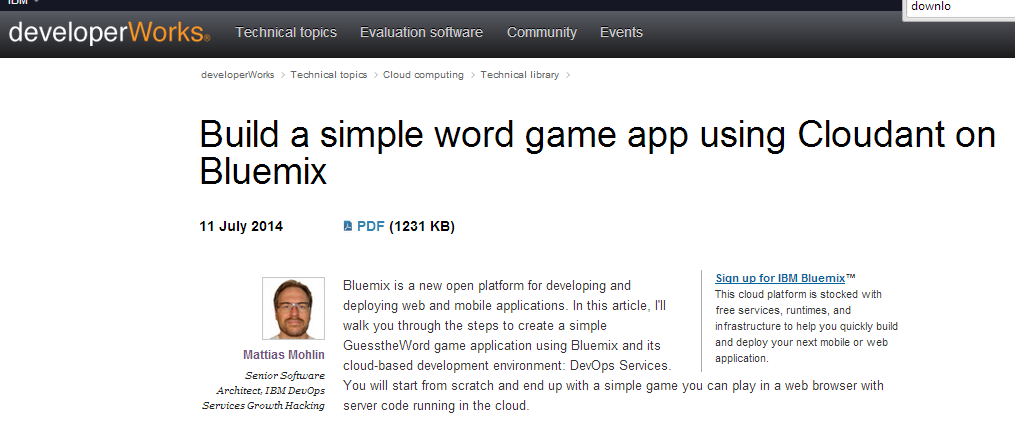
I wanted to learn how to use the Cloudant database with a BlueMix application. I found this great blog post Build a simple word game app using Cloudant on Bluemix by Mattias Mohlin. I’ve been working through it.

image001

I’ve learned a lot from it – as the writer says “I’ll cover aspects that are important when developing larger applications, such as setting up a good development environment to enable local debugging. My goal is to walk you through the development of a small Bluemix application using an approach that is also applicable to development of large Bluemix applications.” So it includes developing on a PC and also setting up Cloudant outside of BlueMix.

So here’s my simplified version focusing purely on getting an application up and running using a Cloudant BlueMix service and staying in DevOps Services as much as possible.

The first step is to take a copy of Mattias’s code so go to the GuessTheWord DevOps Services project.

click on “Edit Code” and then “Fork”

image003

I chose to use the same project name GuessTheWord – in DevOps Services it will be unique as it’s in my project space.

image005

This takes me into my own copy of the project so I can start editing it.

I need to update the host in the manifest file otherwise the deployment will conflict with Mattias’s. So in my case I change it to GuessTheWordGarforth but you’ll need to change it to something else otherwise yours will clash with mine. Don’t forget to save the file with Ctrl-S, or File/Save or at least changing file.

image007

Now I need to set up the app and bind the database on BlueMix so I click on “deploy”. I know it won’t run but it will start to set things up.

At this point I logged onto BlueMix itself for the first time and located the new GuessTheWord in the dashboard.

image009

I clicked on it and selected “add a service” and then scrolled down to the Cloudant NoSQL DB

image011image013

and click on it. I clicked on “create” and then allowed it to restart the application. Unsurprisingly it still did not start as there is more coding to do. However the Cloudant service is there so I clicked on “Show Credentials” and saw that the database has  username, password, url etc so the registration etc on the Cloudant site is not necessary as this is all handled by BlueMix.

image015image017Clicking on Runtime on the left and then scrolling down to Environment variables I can see that these Cloudant credentials have been set up as VCAP_SERVICES environment variables for my app. So I just need to change the code to use these.

I switch back to DevOps Services and go to the server.js file to modify the code for accessing this database.

I change line 27 from
Cloudant = env[‘user-provided’][0].credentials;
to
Cloudant = env[‘CloudantNoSQLDB’][0].credentials;

So we’re providing the high level environment variable not the name or the label.

Unfortunately there is also an error in Mattias’s code. I don’t know whether the BlueMix Cloudant service has changed since he wrote it but he builds the url for the database by adding the userid and password to it but actually these are already in my environment variable url

so I change line 30 from

var nano = require(‘nano’)(‘https://’ + Cloudant.username + ‘:’ + Cloudant.password + ‘@’ + Cloudant.url.substring(8));
to simply
var nano = require(‘nano’)(Cloudant.url);

Now save the file and click deploy. When it’s finished a message pops up saying see manual deployment information in the root folder page.

image019

So I click on that and hopefully see a green traffic light in the middle.

image021

Click on the GuessTheWord hyperlink and should take you to the working game which in my case is running at

http://guessthewordgarforth.mybluemix.net/

image023

However there are still no scores displayed as there is no database table or entries.

I spent a long time trying to do this next part in the code but eventually ran out of time and had to go through the Cloudant website. If anyone can show me how to do this part in code I’d really appreciate it.

So for now, go to the GuessTheWord app on BlueMix and click on the running Cloudant service

image025

From here you get to a Launch button

image027

Pressing this logs you on to the Cloudant site using single sign on

image029

Create a new database named guess_the_word_hiscores. Then click the button to create a new secondary index. Store it in a document named top_scores and name the index top_scores_index. As Mattias says, the map function defines which objects in the database are categorised by the index and what information we want to retrieve for those objects. We use the score as the index key (the first argument to emit), then emit an object containing the score, the name of the player, and the date the score was achieved. Following is the JavaScript implementation of the map function, which we need to add before saving and building the index.

function(doc) {
emit(doc.score, {score : doc.score, name : doc.name, date : doc.date});
}

image031

Again, we should really be able to do the following as part of the program startup but anyway, the following should add an entry to the database, replacing guessthewordgarforth in the URL with the host name you chose for your application:

http://guessthewordgarforth.mybluemix.net/save_score?name=Bob&score=4

You should see a success message. Enter the following URL, again replacing guessthewordgarforth with your application host name.

http://guessthewordgarforth.mybluemix.net/hiscores

The entry you just added should appear encoded in JSON e.g.

[{“score”:4,”name”:”Bob”,”date”:”2014-08-07T14:27:34.553Z”}]

So, the code and the database are working correctly. Now it just remains to play the game. Go to

http://guessthewordgarforth.mybluemix.net

(replacing guessthewordgarforth with your hostname)

This time it will include Bob in the high score table

image033

and click on “Play!”

game

Cloud computing trends in the UK: IaaS, PaaS & SaaS

This post was originally published on ThoughtsOnCloud on June 17th, 2014.

I’ve been a cloud architect foEnglish: Flats on Deansgate with cloud. Manche...r the last three years or so and have seen dramatic changes in the IT industry and its view of cloud. I’ve also observed different attitudes to cloud in different industries and countries.

I took on the cloud architect role because I saw that customers were asking about cloud, but they all had different ideas of what this meant. Depending on whom they spoke to first they could think it was hosted managed software as a service, or they could think it was on-premise dynamic infrastructure—or many other permutations between. My job was created to talk to them at the early stage, explain the full scope of what it means, to look at their business requirements and workloads and align them to the most appropriate solution.

Three years later you would hope that it’s all a lot clearer and in many ways it is, but there are still preconceptions that need to be explained, and also the cloud technologies themselves are moving so rapidly that it’s hard enough for people like me to stay abreast of it, let alone the customers.

To begin, I noticed some fairly obvious differences, many of which still hold. The large financial institutions wanted to keep their data on premise, and they had large enough IT departments that it made sense for them to buy the hardware and software to effectively act as cloud service providers to their lines of business. Some investment banks saw their technology as a key differentiator and asked that I treat them as a technology company rather than a bank, so they didn’t want to give away the ownership of IT, the attributes of cloud that they were looking for were standardisation, optimisation and virtualisation.

On the other hand I was working with retail companies and startups who saw IT as an unnecessary cost, a barrier to their innovation.  They saw cloud as a form of outsourcing, where a  service provider could take on the responsibility of looking after commodity IT and let them focus on their core business.

A third industry is government and public sector. This is very different in the UK to other countries. In the United States, the government is investing in large on-premise cloud solutions, and this avoids many of the security and scalability issues. In the UK, with a new government following the global financial crisis, there is an austerity programme, which led to the Government ICT Strategy and Government Digital Strategy and the announcement of the Cloud First Policy. This requires that government bodies use hosted, managed cloud offerings, as well as encouraging the use of open source and small British providers.

The British Parliament and Big Ben

The British Parliament and Big Ben (Photo credit: ** Maurice **)

Our health sector is also very different to the U.S., with our public sector National Health Service being one of the largest employers in the world, whereas in the U.S. health has much more of an insurance focus.

Over the years in all industries there has been a lot of fear, uncertainty and doubt about the location of data and whether or not there are regulations that make this an issue. I’m glad to say that we’ve now worked through a lot of this and it’s a lot clearer to both the providers and the consumers.

In practice most of the cloud investment that happened was infrastructure as a service (IaaS). Much of this was private cloud, with some usage of public cloud IaaS.

We used to have a lot of interest from customers, whether they be meteorological or academic research, looking for high performance computing clouds. This made a lot of sense, as the hardware required for this is very expensive and some customers only need it for short periods of time, so to have it available on a pay as you go basis was very attractive. Last year, IBM acquired SoftLayer, which includes bare metal IaaS as well  as virtualised. This means that HPC cloud is more attainable and with this has come a change of perception of cloud from virtualisation and closer to the hosted, utility based pricing view.

The big change this year is the move from IaaS to platform as a service (PaaS). With the nexus of forces of mobile devices (phones, tablets, wearable devices, internet of things), social media generating large amounts of unstructured data, and high performance broadband, there is a new demand and ability to deliver cloud based mobile apps connecting and exploiting data from multiple sources. This reflects a shift in the IT industry from the systems of record, which store the traditional, fairly static, structured data, to the new systems of engagement, which are much more about the dynamic customer interface and access to the fast changing data.

Developers are becoming key decision makers. They often work in the line of business and want to create business solutions quickly, without the blocker of the traditional IT department. Optimising the speed to market of business solutions by using IaaS, devops has been the first step in this. Now customers are looking to PaaS to give them immediate access to the whole software development environment of infrastructure as well as the necessary middleware for developing, testing, and delivering solutions quickly and reliably with minimal investment. This also includes the new open source middlewares and hyperpolyglot languages.

Finally, SaaS. We are talking to many companies, public sector bodies, and education establishments, who want to become entirely IT free. They don’t want a data centre and they don’t want developers. This requirement is now becoming achievable as IBM and others are committed to making a significant proportion of their offerings available as SaaS solutions. Of course, this brings new challenges around hybrid cloud integration and federated security.

Do my views of the trends in UK cloud align to yours? I’d love to see your comments on this.

It’s all about the speed: DevOps and the cloud

This post was originally published on ThoughtsOnCloud on April 29th, 2014.

As I explained in my earlier blog post, “Cloud accelerates the evolution of mankind,” I believe that cloud has the power to change the world. It achieves this by giving us speed—and this has an exponential effect.

DevOps and the cloudWhen I first became a professional software developer in the late 1980s, we spent two years designing and writing a software product that our team thought was what the market wanted. We went through a very thorough waterfall process of design (code, unit test, functional verification test, system test, quality assurance) and eventually released the product through sales and marketing. This cost us millions and eventually sold 14 copies.

More recently we’ve begun to adopt lean principles in software innovation and delivery to create a continuous feedback loop with customers. The thought is to get ideas into production fast, get people to use the product, get feedback, make changes based on the feedback and deliver the changes to the user. We need to eliminate any activity that is not necessary for learning what the customers want.

Speed is key. The first step was to move from waterfall to a more iterative and incremental agile software development framework. After that, the biggest delay was the provisioning of the development and test environments. Citigroup found that it took an average of 45 days to obtain space, power and cooling in the data center, have the hardware delivered and installed, have the operating system and middleware installed and begin development.  Today, we replace that step with infrastructure as a service (IaaS).

The next biggest delays in the software development lifecycle are the handovers. Typically a developer will work in the line of business. He will write, build and package his code and unit test it. He then needs to hand it over to the IT operations department to provide a production-like environment for integration, load and acceptance testing. Once this is complete the developer hands it over completely to the operations department to deploy and manage it in the production environment. These handovers inevitably introduce delay and also introduce the chance for errors as the operations team cannot have as complete an understanding of the solution as the developer. Also there will be differences between each environment and so problems can still arise with the solution in production.

By introducing a DevOps process, we begin to merge the development and operations teams and give the power to the developer to build solutions that are stable and easy for IT operations to deliver and maintain. Delivery tasks are tracked in one place, continuous integration and official builds are unified and the same deployment tool is used for all development and test environments so that any errors are detected and fixed early. With good management of the deployable releases, development can be performed on the cloud for provisioning to an on-premises production environment or the reverse; solutions can quickly be up and running in the cloud and as their usage takes off it may prove economical to move them on premises.

Of course there is risk in giving the power to the developer. The handover delays happen for a reason—to ensure that the solution is of sufficient quality to not break the existing environment. This is why the choice of tooling is so crucial. The IBM UrbanCode solution not only automates the process but provides the necessary governance.

Application-release-management

As I discussed in my blog post “Cloud’s impact on the IT team job descriptions,” introducing IaaS to this means that the role of the IT operations department is reduced. They may still be needed to support the environment, especially if it is a private cloud, but the cloud gives self service to the developer and tester to create and access production-like environments directly. It brings patterns to automatically create and recreate reproducible infrastructure and middleware environments.

In my next post I will discuss the next step that can be taken to increase the speed of the development cycle:platform as a service (PaaS). I’d love to hear what do you think are the benefits of DevOps with the cloud and other ways to accelerate delivery? Please leave a comment below.

Enhanced by Zemanta

Cloud With DevOps Enabling Rapid Business Development

My point of view on accelerating business development with improved time to market by using lean principles enabled by devops and cloud.