Was Cloud A Mistake?

Originally published here on August 12, 2021.

I just heard that businesses are repatriating cloud workloads.

I was told, “The history of IT is paved with dreams of lower costs, better performance, and higher reliability through migrations to new platforms and languages and new architectures and infrastructures.”

“Some of the biggest recorded IT waste has been when companies focus on the ‘next big thing’ and have issues achieving successful implementations. Any architectural change comes with risks, and if a company isn’t clear on the risks in terms of feature creep and associated cost and time overruns, they can sometimes decide to ‘de-migrate’”.

I’ve been thinking about this and of course, as a cloud evangelist I have some cognitive dissonance but, if you want the TLDR answer, I don’t think that moving to the cloud was a mistake.

As we’ve said before, the cloud is not new. Many of us who wrote IBM MQ at IBM began by writing IBM SAA APPLICATION CONNECTION SERVICES or AConnS. This was a middleware designed to facilitate the move to the new client-server model. The idea was to run the right workload in the right place and have them work together in an optimum holistic business application. It utilitized the mainframe for its heavy data processing and the PC for its powerful graphical abilities. An application on the PC would call AM (Application Manager) to run mainframe processes, whereas an application on the mainframe would call PM (Presentation Manager) to display the data. Because of this meeting of AM and PM the product was known internally as HighNoon.

Before that, we had the Computer bureau which was Pay As You Go Utility computing access to the mainframe which phased out when companies began to be able to afford their own mainframes or the PC became sufficient.

The point is that you should run your application workload in the most appropriate place at that particular time. Without wanting to get into Schrödinger’s Cat, you can’t just say that a technology platform is right or wrong, you have to look at it in the context of the time. Technology is constantly evolving with invention and innovation, as are other factors such as cost, politics, and security.

At an enterprise level, the concern with cloud over the last 10 years has been around security. Companies have had a castle and moat security approach meaning that everything needs to be stored inside the company premises and they put a barrier around the outside to stop people from getting in. But with the arrival of COVID-19 and home working they’ve had to quickly revisit this. We now have the zero trust model and message-level security. Also, homomorphic encryption is coming much faster than was first thought possible and also confidential computing. We also have quantum computing coming along which will deliver world-changing discoveries and innovation but, as it needs to run at minus 273 degrees Celsius, will need to be accessed as a cloud service.

So, those are changes that are making the cloud more and more appropriate. But on the other hand, the amount of data in the world is rapidly increasing. 79 zettabytes will be created in 2021. That’s up from 64 zettabytes in 2020 and 2 zettabytes in 2010. iPhone photos and videos are getting ever larger and stored on the cloud and more 4K entertainment, education, and business content is provided from the cloud with Netflix, YouTube, Zoom, etc. Shipping all this across the cloud is becoming increasingly hard. With the limit on the speed of light, we need invention in telecoms or to right-size and put the workloads in the appropriate place. With the invention of 5G, being 100 times faster than 4G we were preparing for a dramatic change in our lives. But then governments canceled contracts with the 5G provider Huawei due to security and privacy concerns around involvement with the Chinese government.

And then there’s the moving between cloud providers. If a cloud provider is accused of tax avoidance then a government tax agency needs to consider moving away from them. If a cloud provider is also a retail company then retail companies decide to relocate. If a cloud provider applies for a banking license then finance companies make strategic decisions to migrate from them.

Change is the only constant in IT. Reminiscent of the Sneetches, companies will move workloads to and from the cloud constantly but it’s not a wholesale move. Different parts will move as is appropriate. Parts will always be in transition, so there will always be a hybrid cloud.

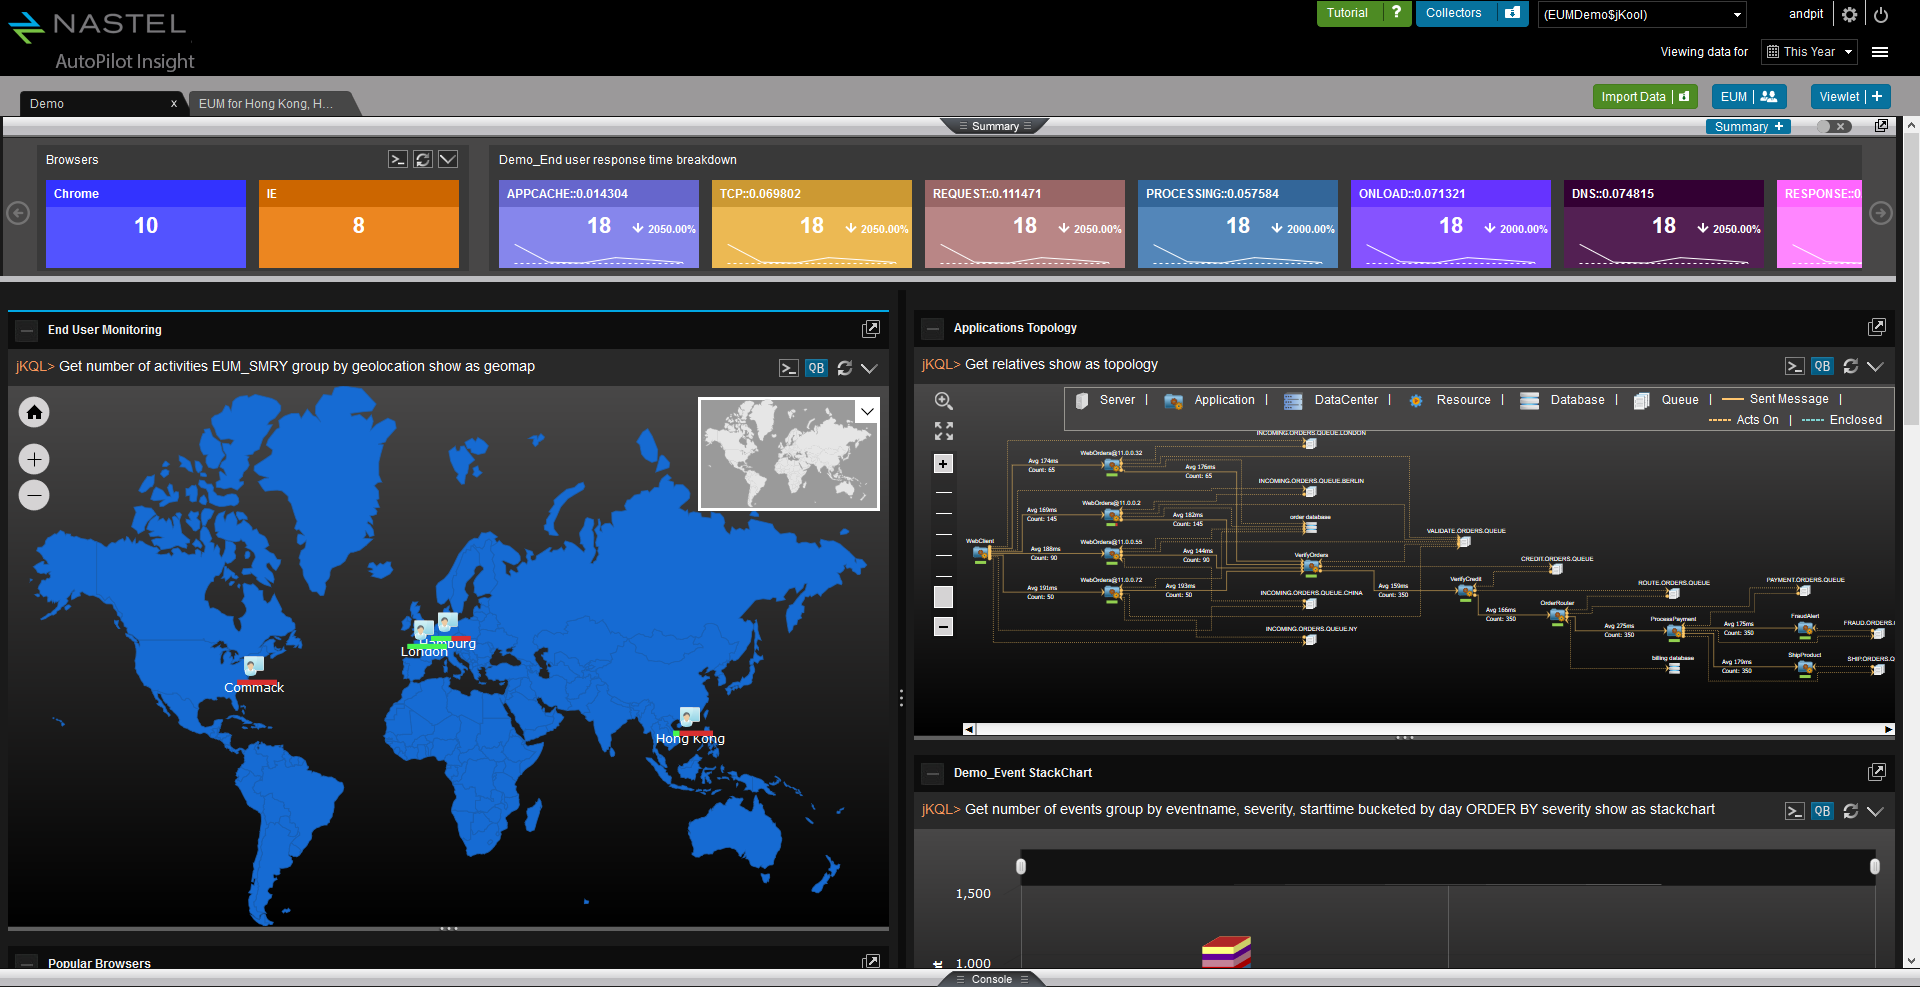
Nastel can help customers move their middleware and message data from on-premise to the cloud and between clouds and back again. And Nastel can monitor the whole end-to-end environment. It can give a single view of the integration infrastructure alerting on the IT availability and the business transaction. Most importantly Nastel software is the fastest at adapting its monitoring when the integration infrastructure changes, which it does constantly. The topology views are dynamically created in real-time based on the current view of the infrastructure. The alerts levels are set based on ongoing statistical analysis (AIOps). There is no need for the monitoring environment to always be out of date, playing catch-up with the changing integration infrastructure. Nastel is here to support you in the ever-changing world of hybrid cloud.

Nastel XRay is a cheaper and better option than ELK, Data lakes, Prometheus, and Grafana

Featured

Nastel XRay is a hosted, managed alternative to ELK, Prometheus and Grafana

Being able to interrogate data about transactions that take place in your IT applications is critical when you need to ensure performance, availability, security and a desired user experience.

Many companies have considered the two choices that are most often discussed, namely the combination of Prometheus and Grafana, and alternatively, the Elastic Stack. Both of these options offer a pathway to desired outcomes, but with some caveats.

ELK (Elasticsearch, Logstash, and Kibana) also known as the elastic stack. ELK is open source, so the software costs are very low, but the complexity of implementation can be immense. A great mind once said “you end up paying twice as much for what you get for free”, and the experience of many indicates this is true with ELK. The combination of Prometheus and Grafana is a similar story.

These options provide powerful tool sets for log management and data analysis, but powerful tools demand experts to operate, and this is both a cost and process concern. Experts are expensive and translating a data request into a query can be very time consuming. If the data being analysed holds knowledge which is only of value immediately, sometimes the effort can be wasted.

There are alternatives!

XRaySJG

One such choice is Nastel XRay which delivers a very cost-effective method of capturing, storing and analysing data in real time.

Key differentiators are:

  • True multi tenancy
  • English-like query language can be used by non-developers
  • Native transaction tracing with automatic computation of latency
  • Understanding of business objectives
  • Much better scaling
  • Can also consume data from Logstash and other ELK stack instrumentation.
  • Can be natively deployed as SaaS and on-prem.
  • Integrated with R language for machine learning.

Unusual patterns or previously identified situations can be identified as signals in the data in real time, allow immediate alerts and actions to be automated. This model allows you to reduce your costs while delivering real-time analysis.

Lower costs, faster results are things we (and you) know you need to consider.

EUM-1

As my colleague said yesterday, “we can say all you want on our website, in blog posts, etc, what REALLY makes a difference in terms of £££ is DOING it in the field, with real customers, that’s where everything gets real. My customer was going full tilt to build a project for testing Prometheus, Grafana,  ELK and Splunk too for leveraging data intelligence until we stopped them. We told them unabashedly : “Gents, we’re sorry but that’s just a dumb strategy, you should be using XRay for that” … sometimes you just have to go balls out with a customer … well, they listened and we delivered.”

In a future post I will discuss how XRay is used for real-time analytics of message payloads to facilitate business decisions and compliance.

I would love to hear your thoughts and experiences in this area. Please comment below or email my directly.

Managing and Enforcing Automated DevOps of MQ Environments

Nastel is well known for producing some powerful GUIs (graphical user interfaces) for managing and monitoring IBM MQ but is there still a place for these as the world moves towards DevOps with automated continuous integration and continuous delivery?

Of course, the answer is yes! All the technology that Nastel has spent 25 years developing as the back end behind the GUIs can provide a secure and robust interface between the new open source tooling and the MQ environments, and the GUIs themselves can still be used as much more intuitive components in the automated software development lifecycle, thus reducing the chances of human error and reducing the cost of ownership.

Untitled

The aim of an automated software development lifecycle is that the definitive source of the truth for the MQ configuration is held in a version control system, that all changes to it are recorded and audited and that the environment can be quickly and automatically be built from this as infrastructure as code. In this way a configuration can be built in one or more development environments, integrated into the version control system, with continuous integration, and then deployed into the test environments, then finally through pre-prod and into production. You can be confident that no manual changes to one environment have been missed in delivery to the next environment. As we move into a cloud-based utility computing world it becomes very useful and financially beneficial to only have environments for as long as they’re needed. We can spin up a test environment, deploy the configuration to it, run the tests and then shut the whole thing down and only pay for the infrastructure during the time when it’s needed.

So, what technologies are people using for this? Well, I’m finding that people are using versions of Git such as Github or Bitbucket for the version control system / source code control repository. For the continuous integration Jenkins is often used, and Ansible (free version or Ansible Tower) can be used to manage the deployment. Chef, Puppet and Terraform are other technologies that many choose as alternatives.

So, isn’t it enough to write lots of scripts using these open source technologies? Why would you need Nastel?

From the beginning (MQ V2) MQ has had a script command processor called MQSC which can define and alter all the objects within a queue manager. These scripts would form the basis of an automated deployment. However, we still need to design the environment which gets scripted, as well as defining the queue managers and associated objects (listener, command server, channel initiator etc).

Nastel Navigator provides a GUI in which a developer can design and unit test an MQ configuration. From here you can save the environment to a script which can be stored in a version control system and act as input to MQSC. With a Nastel agent on the target machine it can create the queue manager and associated objects as well as configuring it.

image002image004

So, you can put the configuration definitions into the source code repository from Navigator, or write them directly as text. Jenkins can detect the updates and pull them from the repository and then pass them to Ansible to initiate the deployment to the next environment.

image006

At this point Ansible can use the Nastel Navigator agent to create or update the new environment using the scripts. There is a lot of security functionality in Navigator which will ensure that developers can only update the objects which they are authorised to and so cannot affect the work or environments of other users or teams. This security and governance is critical to the DevOps dream becoming reality.

image007

So, we’ve migrated a configuration from development to test, and similarly it can move from test to production etc in a robust automated way. So, is that enough? What happens if someone makes changes in the test environment? What if they bypass the tooling and log straight in to fix something in production? How would we detect that? How can we get that change reflected back into the source control repository, to ensure that the Git version remains the golden copy, the single source of the truth, and that if production fails we can always reproduce it?

To address this Navigator can monitor the environment. Firstly, it can receive MQ Configuration events which are generated when certain MQ actions are taken such as alter, create and delete. Secondly, Navigator generates its own Alter events. It constantly compares the MQ environment to the version that it has stored in its database and when it spots a difference it records it as an event.

image008

You can then choose whether to roll back this change or to save it as a script for the version control system.

image010

Finally, how do we know that it’s a valid configuration? How do we know that the design, whether created as a script or through the GUI, conforms to the company’s design standards? Will it actually perform in the expected way? Do all the queue managers have dead letter queues? Have all the listeners and channel initiators been defined? Do all the transmission queues exist that are referred to by the channels and remote queue definitions? Do the objects conform to your naming standards?

This is where Nastel AutoPilot comes in. AutoPilot is a real time performance monitor and typically comes with Navigator. AutoPilot can monitor any of the environments, whether that’s the development environment or the test or production ones, and highlight any issues such as these.

image011

Conclusion

Whilst it is possible to build an automated software development lifecycle environment using open source tools, a lot of the effort can be reduced by adding Nastel’s Navigator and AutoPilot software to the mix, adding in its twenty five years of MQ and monitoring expertise to assure security, governance, and a lower cost of ownership.

I would be very keen to hear your comments, questions and experiences of DevOps with MQ. Please email me at sgarforth@nastel.com to discuss it further or leave comments below.

Getting Started Using Nastel XRay for MQ On-Prem Version

Featured

In my previous blog post, Getting Started Using Nastel XRay for MQ, I gave an overview of Nastel’s free MQ tracing/monitoring/diagnostics solution, available here, and I described how to install and set up the cloud version. This has proved to be very popular but some people would prefer not to send data to the cloud, even if it’s just metadata, so in this post I go through the steps to set up on-premise version.

image001

Purpose

I won’t repeat the whole overview as you can read it in the previous post, but as reminder, the purpose of the Nastel XRay for IBM MQ is to analyse applications making MQ calls and determine their behaviour. Examples of the value of tracing include:

  • Tracking individual application calls:
    • Identify applications doing “unnecessary” calls
      1. Inefficient logic
    • Identify applications not conforming to “standards”
      1. Not providing expiry
      2. Not resetting message ID
    • Observe timings of calls based on different scenarios
      1. Persistence
      2. Different environments
    • Verify correct processing of error conditions
      1. Queue Full, Queue not found, etc.
    • Summarise application calls:
      • Identify Patterns
    • Problem determination:
      • What is the application actually doing?

Many other use cases are possible, for example these MQ events can be used as part of business transaction tracking scenarios.

Installation

There are two components to XRay.

  • The XRay server which hosts all the collected data for search, analytics, visualisation, automation etc.
  • The probe collects the information from MQ. It runs in your MQ environment (or connects remotely to it)

Installing Docker

For on-premise we use the Docker version of the XRay server, which is only available on Linux, although the monitored MQ can be on any platform.

The documentation says that in order to run as a Docker container, the following minimum requirements must be met:

  • 16 GB of RAM (I tried running with 3GB and found that it hung when setting up Solr).
  • 4 virtual processors

I didn’t already have Docker installed so I typed ‘docker’ on the command line and it said

The program 'docker' is currently not installed. You can install it by typing:
sudo apt install docker.io

so that’s what I did, and it installed easily.

It turns out that it’s also really important to run the following command (and log out and in again) to put the user into the docker group, otherwise you can hit problems with the Nastel Xray install.

sudo usermod -a -G docker $USER

Installing the XRay Server

On the first page, click on the Register for Nastel XRay Docker Edition button. Once you’re through the registration process you will be given a link to download the software and another to view the documentation.

Once downloaded, uncompress the software using unzip or your preferred extraction software, and switch to the docker directory

cd XRayStarterPack/docker

There are various scripts in that folder to help you manage the installation. There is one program which provides a menu to call the others:

./xray_menu.sh

Select option 1

1. Deploy XRay Starter Pack containers

This downloads the Docker images, creates the containers and executes them. This is typically only run once. It will ask you for your XRay advertised host name – this just means the host that you’re installing on that the probes will be publishing too. You can normally press enter and accept the default although in may case it was a virtual host with complicated networking so I entered the actual ip address at this point.

It may also ask you for the location of two license files. Just press enter to accept the defaults.

The download time will depend on your bandwidth and then there’s a five minute wait while it configures everything.

Then it will say:

You can reach XRay by this url: http://apsvr:8080/xray

You can stream data to this url: http://apsvr:6580

or similar (my hostname is apsvr).

At this point you can go to a web browser and go to the XRay url and login with user Admin and password admin. Of course, you will change these once you’re up and running.

image003

Once you’re logged in, click on Go to Dashboard
image004

This will take you to the sample repository and the sample dashboards:

image006

You should take a look around these, guided by the installation document.

Then you can switch to your own repository where your own data and dashboards will go.

image008

On the cloud version you would have to import the dashboards but on the Docker version this has already been done.

Installing the Probes

Now you need to install the probes onto your MQ machine. In my case this was onto a separate Windows machine. So, I downloaded the same zip file that I’d put onto Linux and unzipped it on Windows.

run \XRayStarterPack\run\XRay_setup.cmd

It will ask you to enter:

  • the url of the XRay server, so in my case this was http://apsvr:6580
  • your Access Token – for the docker version this is DefaultToken

Next you need to edit

\XRayStarterPack\run\ibm-mq-trace-events\XRayMQ_parser.xml

If the probe is running locally then you just need to provide the queue manager name. Alternatively, you can use a client server connection in which case you’d have to provide the connection information too.

To monitor a second local queue manager just copy the stanza and add the next queue manager name but also change the stream name so that each one is unique. You could also monitor a second queue manage on a second machine by installing the probe on that machine too.

Configure MQ

Switch on activity trace by setting the queue manager property ACTVTRC(ON).

This means that everything will be traced. This is great for getting started. However if you run tools such as MQ Explorer you will find that it generates far too much data so once you’re up and running you’ll want to go back and edit mqat.ini to include or exclude data some applications and functions from the trace.

Run the probe

Now you can start collecting data and seeing it in the dashboards by running the probe on the managed machine with

\XRayStarterPack\run\ibm-mq-trace-events\run.bat

You could actually have done this as soon as you’d configured the probe.

Dashboards

Very soon you should start to see the data appearing in the dashboards

image010

You could also look at the raw events. Click on the plus sign at the bottom:

image012

To get to the jKQL (jKool Query language) command line. If you type in get event it will list all the trace events that it’s received.

image013

Try clicking around on some of the hyperlinks within this. You will notice that all the dashboard viewlets were created with jKQL commands which you can edit too. If you’re feeling adventurous you could even read the jKQL Users Guide here.

Conclusion

The free version is the full function product with the limit that you can stream 500MB of event data per day and store them for 5 days. If you’re careful about what data you capture this could be sufficient for many use cases. Hopefully this blog post has given you an idea of how to use Nastel XRay for MQ on premise and will get you started using it.

Feel free to mail me at sgarforth@nastel.com if you need help or leave comments below.

Getting Started Using Nastel XRay for MQ

Featured

Nastel has a free version of its MQ tracing solution available here. In this post I will give an overview of its purpose, its use, and how to install it.

Purpose

The purpose of the Nastel XRay for IBM MQ is to analyse applications making MQ calls and determine their behaviour. Examples of the value of tracing include:

  • Tracking individual application calls:
    • Identify applications doing “unnecessary” calls
      • Inefficient logic
    • Identify applications not conforming to “standards”
      • Not providing expiry
      • Not resetting message ID
    • Observe timings of calls based on different scenarios
      • Persistence
      • Different environments
    • Verify correct processing of error conditions
      •  Queue Full, Queue not found, etc.
  • Summarise application calls:
    • Identify Patterns
  • Problem determination:
    • What is the application actually doing?

Many other use cases are possible, for example these MQ events can be used as part of business transaction tracking scenarios.

How It’s Used

The dashboards that come with the free installation include:

  • MQ Error Analysis
  • MQ Call Analysis
  • Search for Message Data

You can also create your own dashboards by using the jKQL query language.

The MQ Call Analysis dashboard

There are various viewlets.

Summary

In this case, this shows a summary of all of the MQ calls captured by the queue manager.

MQ Calls by Type

This viewlet breaks down the MQ calls collected by their type.

In this case, we can see a lot of MQOPEN, MQCLOSE and MQCONNX calls which may be interesting sometimes, but in many cases, you will want to focus on the puts and gets. That could be done by modifying the query run to display the data or in the data collected itself.

MQ Object Breakdown

This displays what queues were used, but it could contain topics and other objects for some call types. This viewlet shows the total MQ calls against each MQ queue.

Persistence Percentages

This displays the breakdown by persistence. Many organizations require persistent messages, so this viewlet would be useful to identify which applications are sending non-persistent messages.

You can easily drill into the data to see which queues were in this group. In all viewlets, you can drill in by clicking on the pie chart or the bar chart. Clicking the non-persistent portion of the chart opens a new window at the bottom of the display showing the non-persistent calls.

MQ Calls over Time

This shows the MQ calls being done over the latest day.

MQ Calls by Application

This viewlet will be useful in determining which applications are being traced.

The MQ Error Analysis Dashboard

This dashboard has details specific to MQ errors that are occurring. The following are the viewlets

Summary

The first summary shows the total number of MQ errors by queue manager and the second shows the total number by MQ error code.

MQ Calls by Completion Code

This shows the errors versus the total number of calls. In this case, 60 requests resulted in an error, just over 8 percent.

MQ Exception List

This shows the breakdown of the errors by type. In this case, the majority were inhibited put events. You can link to see which requests these were.

The Search for Message Data Dashboard

When you click on this tab, a dialog will be presented.

Enter a string from the message payload, for example Payment. The viewlet will refresh and display the matching requests.

You can select the envelope icon next to the message preview to view the entire message

Alternatively the general search field can be used to search across all data elements, including the payload, but also the queue name, queue manager name, user, and so on.

Installation

There are two versions available – one hosted in the cloud and one is in a docker container so can be installed on-premise. In this blog post I talk through my experience of using the cloud based one monitoring a Windows environment.

There are two components to XRay.

  • The probe collects the information from MQ. It runs in your MQ environment (or connects remotely to it)
  • The XRay server which hosts all the collected data for search, analytics, visualisation, automation etc.

You download the probe software from here.

You register to use the server here.

Configure the probe

Uncompress the probe software and run \XRayStarterPack\run\XRay_setup.cmd

It will ask you to enter:

Next you need to edit \XRayStarterPack\run\ibm-mq-trace-events\XRayMQ_parser.xml

If the probe is running locally then you just need to provide the queue manager name. Alternatively you can use a client server connection in which case you’d have to provide the connection information too.

To monitor a second local queue manager just copy the stanza and add the next queue manager name but also change the stream name so that each one is unique. You could also monitor a second queue manage on a second machine by installing the probe on that machine too.

Configure MQ

Switch on activity trace  by setting the queue manager property ACTVTRC(ON).

This means that everything will be traced. This is great for getting started. However if you run tools such as MQ Explorer you will find that it generates far too much data so once you’re up and running you’ll want to go back and edit mqat.ini to include or exclude data some applications and functions from the trace.

Configure the XRay Dashboards

Log in to the XRay server and click on Go to Dashboard

Go to the repository list where all the samples are as well as your own repository at the top

Select your repository

The next dialog box will ask you to create a dashboard. Just click cancel on that as we want to import the ones that came in the download of the probe software. On the top right corner of the screen, click on the Main Menu icon and select Import/Export > Dashboards.

Import the file \XRayStarterPack\XRayStarterPack\dashboard\NastelXRayMQStarterPackDashboard.json

After a short pause, the list of dashboards will be presented. Select All and click Open.

Run the probe

Now you can start collecting data and seeing it in the dashboards by running the probe on the managed machine with

\XRayStarterPack\run\ibm-mq-trace-events\run.bat

You could actually have done this as soon as you’d configured the probe.

Conclusion

Hopefully this blog post has given you an idea of how to use the free version of Nastel XRay for MQ and will get you started using it. Feel free to mail me at sgarforth@nastel.com if you need help or leave comments below.

Using Nastel’s MQSpeedtest to Test MQ Performance in a Multi-hop Architecture

Featured

In my previous blog post here I described how to get started using Nastel’s free MQSpeedtest application (available here) to check the performance of your MQ environment.
Today I decided to try it out in an architecture with multiple queue managers. I have an application architecture that looks like the following:

So an application starts the transaction by putting to Queue Manager A. This is sent to Queue Manager B. An application receives that message, does some processing and then sends a related message on to Queue Manager C where the final part of the transaction processing occurs.
I wanted to set up some monitoring in parallel to this so that I could see that the MQ flow itself from A to B to C was performing adequately. So I set up the following ping architecture:

I ran the following command:

 MQSONAR RTOQMCPCF QMA -fmqsonar.csv -a -d5

Converting the output into a chart looked like this:

Next I ran the MQSpeedtest from A to B (plotted as QMB) and the MQSpeedtest from A to B to C (plotted as QMC) at the same time. This produced the following graph.

So here you can see that:
• I started recording before starting the channels, so initially the route to both QMB and QMC was blocked.
• I started both channels which meant that the route to both QMB and QMC was fine
• I stopped channel QMB.TO.QMC which meant that the route to QMC was blocked but the route to QMB was fine
• I started channel QMB.TO.QMC which meant that the route to both QMB and QMC was fine
• I stopped channel QMA.TO.QMB which meant that the route to both QMB and QMC was blocked
• I stopped channel QMB.TO.QMC which had no immediate effect but affected the following step
• I started channel QMA.TO.QMB which meant that the route to QMB was fine but the one to QMC was still blocked
• I started channel QMB.TO.QMC which meant that both routes were fine again
Following this I can start forwarding the data to Nastel’s AutoPilot and XRay products for real time availability monitoring and historical trend analysis.

Getting started using Nastel’s MQSpeedtest for IBM MQ

Featured

Nastel has a free download available here called AutoPilot MQSpeedtest for IBM MQ. The purpose of the MQSpeedtest utility is to measure various times related to queue manager message flow. Much like traditional sonar technology, this is completed by sending a ping which is picked up by the target and echoed back. By measuring the time spent it can determine various characteristics of the message path. In IBM MQ terms, it sends messages to a listening application which replies with a response to those messages. MQSpeedtest captures various times along the message path as well as the round-trip times.

By default, the echo application can be the IBM MQ Command Server but, for users that do not have administrative permission to use this, Nastel also provide a Speedtest echo application.

The following are some basic configurations that can be implemented using MQSpeedtest:

Single queue manager:

  • determine if the queue manager is up and responding
  • determine standard throughput for a (set of) queues
  • compare the behaviour of different queue configurations such as using persistent versus non-persistent messages.

Multiple queue managers:

  • Identify slowdowns in inter-queue manager communication
  • Identify queue managers that contribute to delays
  • Identify differences in behaviours of different queue managers
  • Verify that a path from one sending application to the receiving application is properly configured.

These diagrams show the configurations that I have tested so far. There are also multi-hop options that I will try in the future.

To test the single queue manager scenario, I ran the following from a Windows command console as an administrator:

mqsonar SYSTEM.ADMIN.COMMAND.QUEUE QMA

It gave the following output:

Pinging QMA(SYSTEM.ADMIN.COMMAND.QUEUE) using 36 byte 10(msgs) batch....
Statistics for queue QMA(SYSTEM.ADMIN.COMMAND.QUEUE) :
Summary Performance Indicators :
        MINIMUM_ROUND_TRIP       (0.0250 sec/msg)
        MAXIMUM_ROUND_TRIP       (0.0280 sec/msg)
        AVERAGE_ROUND_TRIP       (0.0266 sec/msg)
        AVERAGE_PROPAGATION_TIME (0.0240 sec/msg)
        AVERAGE_REFLECTION_TIME  (0.0026 sec/msg)
        MESSAGES_SENT            (10)
        CONFIRMED_EXPIRIES       (0)
        CONFIRMED_DELIVERIES     (0)
        CONFIRMED_ARRIVALS       (0)
        CONFIRMED_EXCEPTIONS     (0)
        REPORTS_RECEIVED         (0)
        RESPONSES_RECEIVED       (10)
        MESSAGES_RECEIVED        (10)
        BYTES_SENT               (360)
        BYTES_RECEIVED           (360)
        RESPONSE_REQUEST_RATIO   (100.0000%)

General Performance Indicators :
        TOTAL_PUT_TIME           (0.0000 sec)
        TOTAL_GET_TIME           (0.0280 sec)
        AVERAGE_PUT_RATE         (10000.0000 msg/sec [360000.00 bytes/sec])
        AVERAGE_GET_RATE         (357.1429 msg/sec [12857.14 bytes/sec])
        PUT_GET_RATE_RATIO       (2800.0000% [28.00])

Message Performance Indicators :
        GROSS_ROUND_TRIP_RATE    (714.2857 msg/sec [25714.29 bytes/sec])
        EFFECTIVE_ROUND_TRIP_RATE(714.2857 msg/sec)
        CONFIRMATION_OVERHEAD    (0.0000% [0.00])
        AVERAGE_ARRIVAL_RATE     (0.0000 msg/sec])
        AVERAGE_DELIVERY_RATE    (0.0000 msg/sec])
        AVERAGE_MSG_LATENCY      (0.0000 sec]) WITH QDEPTH(0)
        MAXIMUM_MSG_LATENCY      (0.0000 sec]) WITH QDEPTH(10)

        TOTAL_BATCH_TIME         (0.1630 sec)
        TEST_COMPLETION_CODE     (0)

Pinging QMA(SYSTEM.ADMIN.COMMAND.QUEUE) completed with RC(0)

To test the two queue manager scenario, I ran the following from a Windows command console as an administrator:

mqsonar RTOQMBPCF QMA

which gave the following output:

Pinging QMA(RTOQMBPCF) using 36 byte 10(msgs) batch....

Statistics for queue QMA(RTOQMBPCF) :

Summary Performance Indicators :
        MINIMUM_ROUND_TRIP       (0.0000 sec/msg)
        MAXIMUM_ROUND_TRIP       (0.0030 sec/msg)
        AVERAGE_ROUND_TRIP       (0.0015 sec/msg)
        AVERAGE_PROPAGATION_TIME (0.0000 sec/msg)
        AVERAGE_REFLECTION_TIME  (0.0025 sec/msg)
        MESSAGES_SENT            (10)
        CONFIRMED_EXPIRIES       (0)
        CONFIRMED_DELIVERIES     (0)
        CONFIRMED_ARRIVALS       (0)
        CONFIRMED_EXCEPTIONS     (0)
        REPORTS_RECEIVED         (0)
        RESPONSES_RECEIVED       (10)
        MESSAGES_RECEIVED        (10)
        BYTES_SENT               (360)
        BYTES_RECEIVED           (360)
        RESPONSE_REQUEST_RATIO   (100.0000%)

General Performance Indicators :
        TOTAL_PUT_TIME           (0.0010 sec)
        TOTAL_GET_TIME           (0.0040 sec)
        AVERAGE_PUT_RATE         (10000.0000 msg/sec [360000.00 bytes/sec])
        AVERAGE_GET_RATE         (2500.0000 msg/sec [90000.00 bytes/sec])
        PUT_GET_RATE_RATIO       (400.0000% [4.00])

Message Performance Indicators :
        GROSS_ROUND_TRIP_RATE    (4000.0000 msg/sec [144000.00 bytes/sec])
        EFFECTIVE_ROUND_TRIP_RATE(4000.0000 msg/sec)
        CONFIRMATION_OVERHEAD    (0.0000% [0.00])
        AVERAGE_ARRIVAL_RATE     (0.0000 msg/sec])
        AVERAGE_DELIVERY_RATE    (0.0000 msg/sec])
        AVERAGE_MSG_LATENCY      (0.0000 sec]) WITH QDEPTH(0)
        MAXIMUM_MSG_LATENCY      (0.0000 sec]) WITH QDEPTH(10)

        TOTAL_BATCH_TIME         (0.0380 sec)
        TEST_COMPLETION_CODE     (0)

Pinging QMA(RTOQMBPCF) completed with RC(0)

Many other options are also available. It can run as a client too.

MQSpeedtest statistics can be captured in a CSV file and used to produce a spreadsheet of historical data. For example, you can capture data on a daily basis, and append the results to an existing file each day.

Example parameters:

1. -fmqsonar.csv

Writes a header and a single result line to msqsonar.csv.

2. -fmqsonar.csv -a

Appends only a result line to mqsonar.csv.

3. -fmqsonar.csv -a -d60

Appends a header and a result line every 60 seconds to msqsonar.csv.

You can import this file into Excel or other spreadsheet to produce charts such as the figure below.

The tool can also be integrated with Nastel’s AutoPilot and XRay products for real time availability monitoring and historical trend analysis.

How the cloud is revolutionizing roles in the IT department

This post was originally published on ThoughtsOnCloud on November 10th, 2014.

Many people see cloud as an evolution of outsourcing. By moving their traditional information technology (IT) resources into a public cloud, clients can focus on their core business differentiators. Cloud doesn’t nix the need for the hardware, software and systems management—it merely encapsulates and shields the user from those aspects. It puts IT in the hands of the external specialists working inside the cloud. And by centralizing IT and skills, a business can reduce cost and risk while focusing on its core skills to improve time to market and business agility.

But where does this leave the client’s IT department? Can they all go home, or do some of the roles remain? Are there actually new roles created? Will they have the skills needed for this new environment?

Changes Crossroad SignLet’s look in more detail at some of these roles and the impact that the extreme case of moving all IT workloads to external cloud providers would have on them:

IT strategy

Strategic direction is still important in the new environment. Business technology and governance strategy are still required to map the cloud provider’s capabilities to the business requirements. Portfolio management and service management strategies have increased importance to analyze investments, ascertain value and determine how to get strategic advantage from the standardized services offered by cloud. However, the role of enterprise architecture is significantly simplified.

Control is still needed although the scope is significantly reduced. IT management system control retains some budgetary control, but much of its oversight, coordination and reporting responsibilities are better performed elsewhere. Responsibility for portfolio value management and technology innovation is mainly handed to the cloud provider.

At the operational level, project management is still required. Knowledge management has reduced scope, but best practices and experiences will still need to be tracked.

IT administration

The scope of IT business modeling is reduced, as many of the functions in the overall business and operational framework are no longer required.

There are changes in administration control. Sourcing relationships and selection are critical for the initiation and management of relationships with providers. Financial control and accounting will continue to manage all financial aspects of IT operations. Human resources planning and administration are still required, but the number of people supported is reduced. Site and facility administration is no longer needed.

All of the operational roles in IT administration have increased importance. IT procurement and contracts as well as vendor service coordination are needed to manage the complex relationships between the enterprise and cloud provider. Customer contracts and pricing is needed for the allocation of cloud costs to internal budgets as well as providing a single bill for services from multiple cloud providers.

Service delivery and support

The main casualties of the move to cloud are the build and run functions. The service delivery strategy will remain in house, although it becomes largely redundant once the strategic decision has been made to source solely from the cloud. Responsibility for the service support strategy moves to the cloud provider.

Service delivery control and service support planning move to cloud provider. Infrastructure resource planning functions are likely to be subsumed into the customer contracts and pricing administration role.

Responsibility for service delivery operations and infrastructure resource administration moves to cloud provider. The help desk and desk-side support services from service support operations remain essential activities for initial level one support, but beyond this, support will be offered by the cloud provider.

Further observations

Governance is a critical capability, particularly around maintaining control over software as a service adoption. Integration of services will be a challenge, but perhaps this will also be available as a service in the future. Relationships with partners and service providers in all guises will become increasingly important.

There is a potential issue with skills. With many of the traditional junior roles in development and operations moving outside the enterprise, it’s hard to see how candidates for these new strategy and coordination roles will gain the experience they need. Academia has an important part to play in ensuring that graduates are equipped with the right skills.

In summary:

• Most current job roles remain, although many have reduced scope or importance.
• Fewer strategic roles are impacted than control or operational ones.
• Build and Run are the main functions which move to the cloud providers.
• Planning and commercial skills are key, linking the IT department more closely to the business.

Can you think of other roles that will be affected by the coming changes? Is your organization ready? Leave a comment below to join the conversation.

Demonstration: cloud, analytics, mobile and social using IBM Bluemix

This post was originally published on ThoughtsOnCloud on January 3rd, 2015.

In the 2013 IBM Annual Report, IBM Chairman, President and Chief Executive Officer Ginni Rometty talked about the shifts that she sees occurring in industries:

“Competitive advantage will be created through data and analytics, business models will be shaped by cloud, and individual engagement will be powered by mobile and social technologies. Therefore, IBM is making a new future for our clients, our industry and our company…As important as cloud is, its economic significance is often misunderstood. That lies less in the technology, which is relatively straightforward, than in the new business models cloud will enable for enterprises and institutions…The phenomena of data and cloud are changing the arena of global business and society. At the same time, proliferating mobile technology and the spread of social business are empowering people with knowledge, enriching them through networks and changing their expectations.”

Consequently, IBM is focusing on three strategic imperatives: data, cloud and engagement.

Recently I have been demonstrating this in a holistic way by showing the fast deployment of an application running on IBM Bluemix, the company’s platform as a service (PaaS) offering. It’s a social analytics application that provides cross-selling and product placement opportunities enabling systems of engagement with systems of insight. It analyzes social trends like tweets to help sales, marketing and operational staff to target specific customers with more personalized offers using mobile technologies.

Take a look at this video of my demonstration:

How governments can tap into cloud and Internet of Things

This post was originally published on ThoughtsOnCloud on October 2nd, 2014.

In my previous post, I discussed some of the innovations that can be achieved by governments using cloud. I presented on this topic recently at the Westminster eForum Keynote Seminar: Next steps for cloud computing. At the session I went on to explore mobile, the Internet of Things and some changes in the skills needed for cloud.

The session abstract asked the following question about mobile: As device processing power increases, yet cloud solutions rely less and less on that power, is there a disconnect between hardware manufacturers and app and software developers? I think this misses the point. Cloud isn’t about shifting the processing power from one place to another; it’s about doing the right processing in the right place.

U.S. Marine using GPS capabilities on a handheld device to check his location.

At IBM, we talk about the nexus of forces of cloud, analytics, mobile and social (CAMS) and we split information technology (IT) into Systems of Record and Systems of Engagement.

The Systems of Record are the traditional IT—the databases that we’re talking about moving from the existing data centers to the cloud. And, as I’ve discussed in a previous post, moving into the cloud means that we can perform a lot of new analytics.

With mobile and social we now have Systems of Engagement. We have devices that interact with people and the world. Because of their fantastic processing power, these devices can gather data that we’ve never had access to before. For example, these devices make it really easy to take a photo of graffiti or a hole in the road and send it to the local council through FixMyStreet in order to have it fixed. It’s not just the additional processing power; it’s the new instrumentation that this brings. We now have a GPS location so the council knows exactly where the hole is.

In a case I discussed in my previous post, this would have made it a lot easier to send photos and even videos of Madeleine McCann to a photo analytics site, to assist in the investigation of her disappearance in 2007.

We’re also working with Westminster council to optimize their parking. The instrumentation and communication from phones helps us do things we’ve never done before, moving us onto the Internet of Things and making it possible to put connected sensors in parking spaces.

With connected cars, we have even more instrumentation and possibilities. We have millions of cars with thermometers, rain detection, GPS and connectivity that can tell the National Weather Service exactly what the weather is with incredible granularity, as well as the more obvious solutions like traffic optimization.

Let’s move on to talk about skills. IBM has an Academic Initiative in which we supply software to universities at no cost, and IBMers work with university administrators and professors on the curriculum and even act as guest lecturers. For Imperial College, we’re providing cloud based marketing analytics software as well as data sets and skills, so that they can focus on teaching the subject rather than worrying about the IT. Since computer science curriculum in schools is changing to focus more on programming skills, we can offer cloud based development environments like IBM Bluemix. We’re working with the Oxford and Cambridge examination board on their modules for cloud, big data and security.

Students at the lecture 21440848

To be honest, it’s still hard. Universities are a competitive environment and they have to offer courses that students are interested in rather than ones that industry and the country need. IT is changing so fast that we can’t keep up.

Lecturers will teach subjects that they’re comfortable with and students will apply for courses that they understand or that their parents are familiar with. A university recently offered a course on social media analytics, which you’d think would be quite trendy and attractive, but they only had two attendees. It used to be that universities would teach theory and the ability to learn, and then industry would hire them and give them the skills. Now, things are moving so fast that industry doesn’t have the skills and is looking for the graduates to bring them.

Looking at the strategy of moving to the cloud and the changing role of the IT department, we’re finding that outsourcing the day-to-day running of the technology brings about a change in skills needed. It’s less about hands-on IT and more about architecture, governance, and managing relationships with third party providers. A lot of this is typically offered by the business faculty of a university, rather than the computing faculty. We need these groups to work closer together.

To a certain extent, we’re addressing this with apprenticeships. IBM has been running an apprenticeship scheme for the last four years. This on-the-job training means that industry can provide hands-on training with the best blend of up-to-the-minute technical, business and personal skills. This has been very effective, with IBM winning the Best Apprenticeship Scheme from Target National Recruitment Awards and National Apprenticeship Services and Everywoman in technology.

In summary, we need to be looking at the new things that can be achieved by moving to cloud and shared services; exploiting mobile and the internet of things; and training for the most appropriate skills in the most appropriate way.

How do you think governments should utilize cloud and the Internet of Things? And what changes do you think are needed to equip students for a cloud based future? Please leave a comment to join the conversation.